
multilevel matrix by xerppa
Master Financial Analysis with Power BI
Discover how to transform your financial structures and visualizations with the most advanced approach in Power BI.
Why take this course?
The training is focused on helping finance professionals unlock the full value of Power BI and the Multilevel Matrix by Xerppa. This is a specialized path to master financial modeling and reporting structures that truly support business decision-making..
Modeling -
first mindset
Build robust financial models with a star schema approach. Learn how to define business logic in the data model — not inside the visuals — ensuring consistency and control.
Structured, scalable reporting
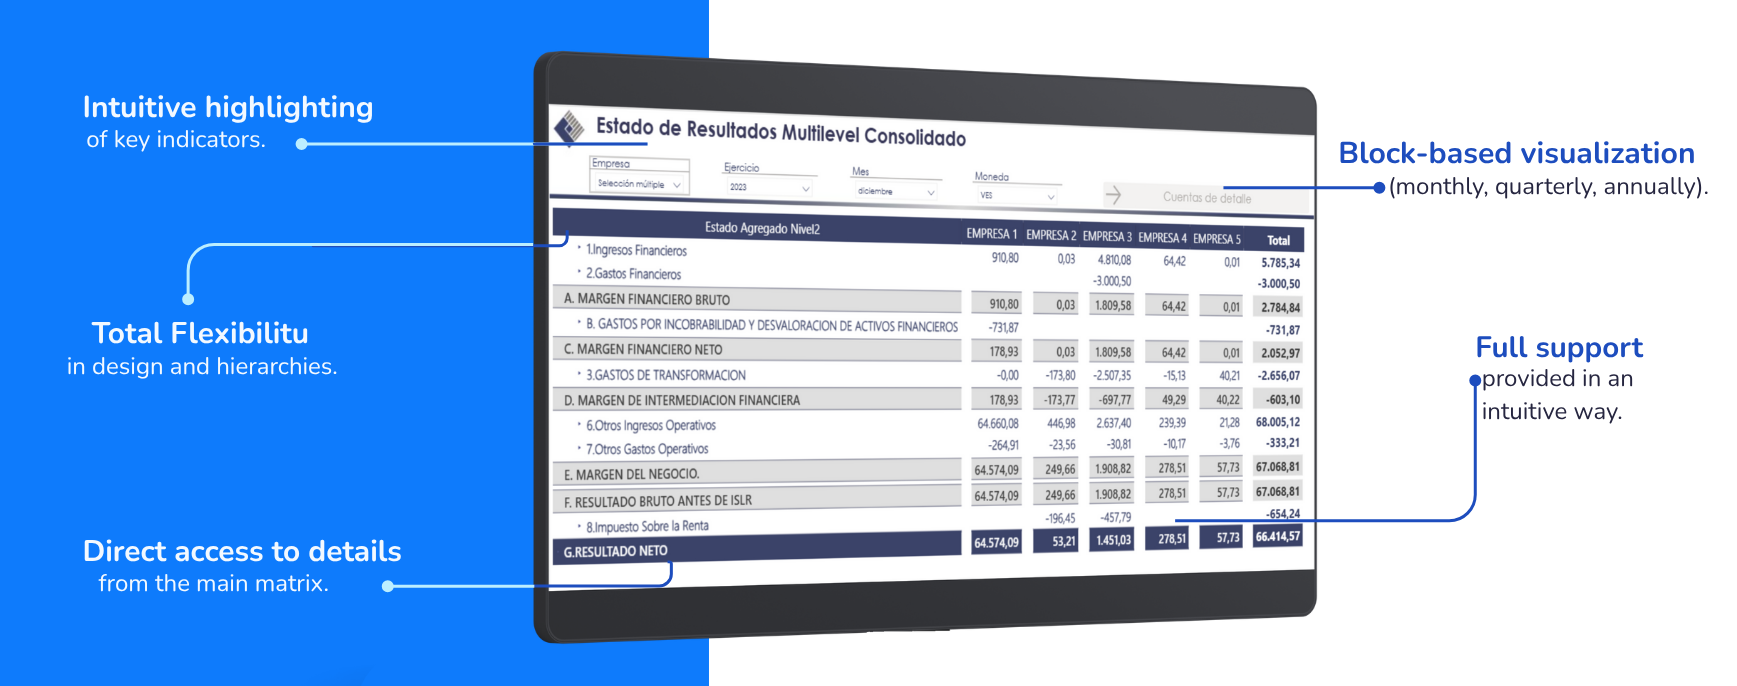
Visualize complex hierarchies such as income statements and P&L structures with unmatched clarity. Use the Multilevel Matrix to create custom visual levels that align with your reporting needs.
Designed for finance professionals
A technical training designed for CFOs, controllers, and finance teams who want to raise the bar in reporting standards. From business units to board-level dashboards, bring structure, accuracy, and governance to your reporting.
Course Lessons
The Key Tool
Multilevel Matrix by Xerppa
The Multilevel Matrix is the core component of this training. A custom visual that takes financial reporting to the next level, enabling clear, configurable hierarchical structures fully aligned with the data model.
Quality That Drives Results
We offer specialized training in financial modeling with Power BI, designed by experts in financial control and performance management. Everything you need to transform your financial reporting — in one focused, technical program.
Start free with our introductory course
Get access to a free course that lays the foundation of financial modeling in Power BI. Built around real business structures and accounting logic you’ll use throughout the program.
Build your financial model step by step
Learn how to structure your data model properly, create DAX measures, and design financial hierarchies ready for advanced visual reporting — all aligned with professional standards.
Implement the Multilevel Matrix by Xerppa
Apply advanced hierarchical visualizations using fully customizable visual levels. Total control over layout, formatting, and behavior — all driven from the data model.
Master high-impact financial reporting
Your reports won’t just be accurate — they’ll be powerful. Clear, scalable, consistent. With a visual standard embedded in the data model. Professional reporting, elevated.
Our users have
a few nice things to say about us
#is unexpected | #is awesome | #has quality features | #saved my life | #is the best
Next-level visual
"Since its launch, the Multilevel Matrix has become my go-to visual for matrix reports. I can fully adapt it to the end-user’s needs, which significantly increases dashboard value."
Ventura Burgui
Outstanding visualization tool
"Accessing financial data efficiently is a constant challenge. With Xerppa Multilevel Matrix, we can display financial statements by month, quarter, or semester — without building multiple pages. A smart visual solution for financial control"
Neshma rojas
Spectacular matrix
"I’ve tested many options, and this one is by far the best. It offers the reliability and scalability we need and is always aligned with our data model. This is what professional reporting should look like."
álvaro aguirre

We are an online educational platform that helps professionals and aspiring individuals to succeed in their goals.
Copyright © 2026
Created with